 The economic crisis created by COVID-19 has led to unprecedented unemployment. Across industries, workers are facing reduced hours, temporary furloughs, and permanent layoffs. Hiring has not stopped, however. Companies are working to fill openings that existed before the outbreak and to bring on new employees to meet changes in demand caused by the crisis.
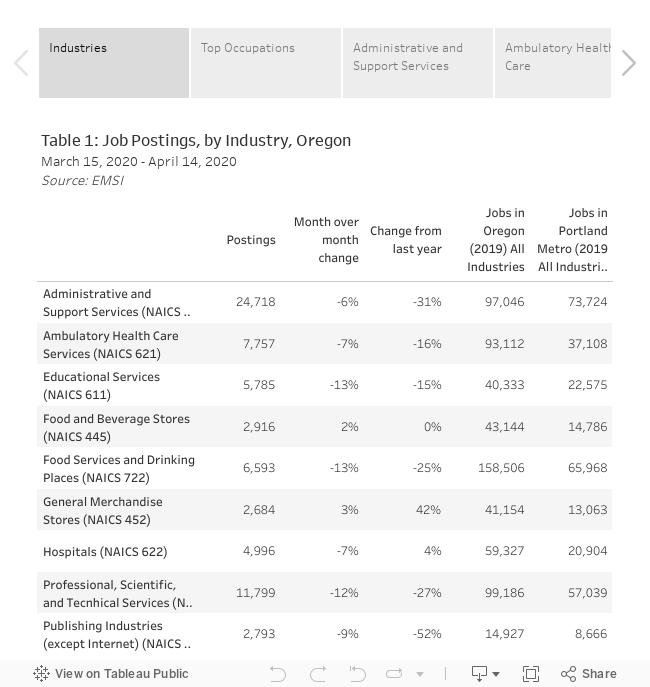
Job postings show who is hiring and what jobs they need to fill. Tracking job posting trends and comparing them to the previous month and 2019 averages shows changes in the labor market. The tables below detail the industries (Table 1) and occupations (Table 2) with the largest number of postings during the past month. We also look at the most in demand occupations within those industries (Table 3-12).
Between March 15 and April 14, 2020, there were 147,693 unique job postings in Oregon. This represents a 9% decrease from the pervious month and a 16% decrease for the same period in 2019. Of the ten industries with the largest number of total job postings (representing 51% of all postings), two showed a slight increase in the number of postings relative to the previous month (Food and Beverage Stores 2% and General Merchandise Stores 3%). General Merchandise Stores was the only industry to show both positive month over month growth (3%) and positive growth from the same period last year (42%).
During this period, the most in demand occupations were Registered Nurses (9,1215 unique postings) and Heavy and Tractor-Trailer Truck Drivers (8,350 unique postings). Both showed an increase in the number of postings relative to the previous month (9% Registered Nurses and 3% Truck Drivers). However, when compared to the same month in 2019, the demand for both occupations, and indeed the demand for nearly all occupations, was down (-16% Registered Nurses and -37% Truck Drivers).
A handful of occupations show an increase in demand both month over month and year over year. These include Cashiers (1,498 postings; 7% month over month increase; 48% change from last year), Interpreters and Translators (454 postings; 121% month over month increase; 229% change from last year), and Home Health Aides (460 postings; 17% month over month increase; 5% change from last year). These occupations tend to be low-wage and represent a small portion of the labor market.
While overall demand is down, demand patterns across industries are shifting. For example, overall demand for Heavy and Tractor-Trailer Truck Drivers was down 37% from last year. This is not consistent across industries. Some showed an increased demand from last year (Administrative and Support Services 9%; Food and Drinking Places 109%; Waste Management and Remediation Services 77%; and Rental and Leasing 93%) while others showed a decrease (Truck Transportation -55%; Support Activities for Transportation -59%; Professional, Scientific, and Technical Services -82%; Food and Beverage Stores -29%; Merchant Wholesalers, Nondurable Goods -80%; Merchant Wholesalers, Durable Goods -44%).
Tracking changes in demand can help some workers find new jobs quickly.
To learn more about the changings demand for individual occupations and industries, and to compare with national and state trends, visit EMSI’s interactive Job Postings Dashboard.